Sometime around mid-September (of the last year!) I was tipped off about a new network forensics challenge created by @TekDefense and published on his blog. I was all up for the challenge but I did not have much time back then. Finally, I managed to spend a few evenings just before the due date to perform my analysis of the provided PCAP and document my findings.
Warning: Spoilers ahead! If you did not take the challenge yet, consider going back and trying to solve it by yourself!
To my big surprise my write-up was awarded first place. @TekDefense posted it in this blog post. Make sure to also check out @CYINT_dude’s write-up which took second place. With all that I decided to write a short follow-up, presenting how I performed my analysis and how I came to final conclusions.
Before we start please remember that:
- This walkthrough and my original solution are by no means complete and probably do not tell the whole story.
- I am not going to present any novel analysis techniques here. I basically followed the bottom-up principle - started with the initial alert and built the story as I was going through related events.
- As always - there is more than one way to skin a cat. I would be happy to learn about different or better ways to process challenge data, correlate events, analyze files, identify indicators and write detection rules.
Toolbox
First things first. Let’s go briefly through tools I used to analyze the PCAP, develop detection rules, create a timeline and final report:
- Wireshark/tshark
- FakeNet
- Snort
- YARA
- Microsoft Excel
- Mou
- Usual command line utilities: sort, uniq, wc, cut, strings, file
In addition to above-mentioned, I used a locked-down virtual machine running Kali Linux to execute suspicious ELF binaries.
It is also important to mention online resources and OSINT tools that were crucial for me to get additional context or better understanding of files, malware and indicators I encountered during investigation:
- VirusTotal
- DomainTools
- PassiveTotal
- MalwareMustDie
- Akamai - Threat Advisory: “BillGates” Botnet
- Novetta - The Elastic Botnet Report
Reconnaissance
Having all of my tools of trade handy I decided to load the PCAP into Wireshark and start from there. As the provided Snort signature was simple and only looked for two strings it was easy to find matching packets without a need to use Snort:
1
| |
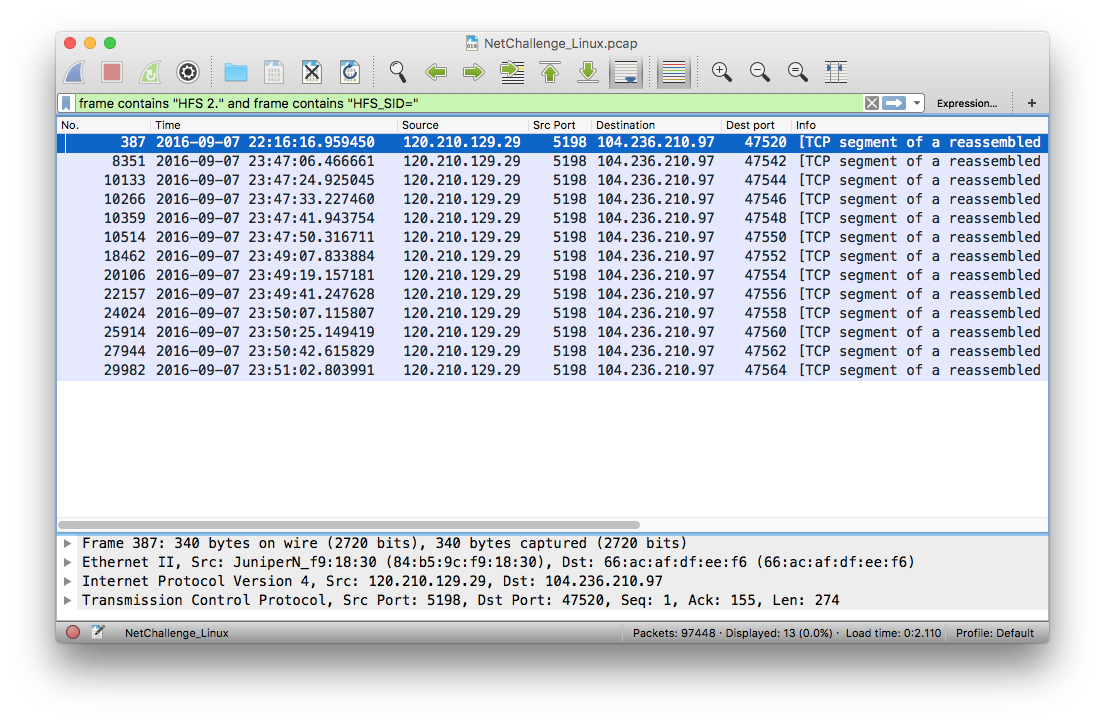
Wireshark found 13 matching packets, each belonging to different TCP session (based on different destination ports). The Snort signature seemed to be looking for the server version and part of HTTP cookie headers set by the server in HTTP response:
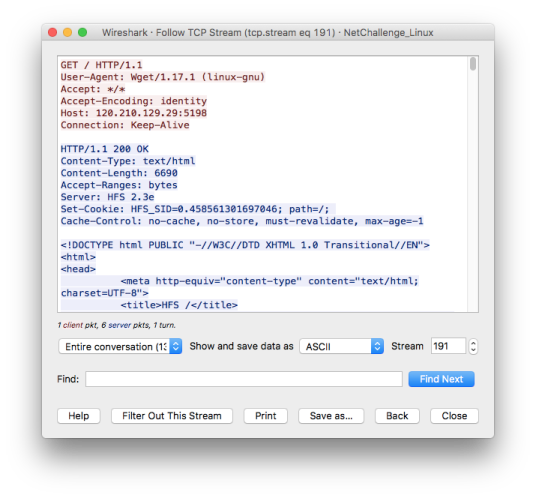
Quick Google search revealed that strings in HTTP headers are characteristic to HTTP File Server (HFS) - a server designed for file sharing. According to provided challenge scenario it was a Snort hit that alerted customer about (potentially) suspicious activity.
I started wondering why file transfer from a server running specific software (HFS) could be a (potential) indicator of compromise? Well, it did not take long until I came across articles from Antiy and MalwareMustDie describing how vulnerable HFS servers were being exploited in order to serve malware.
At this point I assumed that the server 104.236.210.97 belonged to the client and was a target of malicious activity.
Initial Analysis
As the provided PCAP file was roughly 56 megabytes I felt like I need to get a better understanding of what kind of traffic was actually captured there.
With the help of several tshark filters presented below I obtained some basic stats on network protocols, sessions and ports present in the PCAP. My initial goal was to at least skim through traffic for top protocols and sessions and look for anything suspicious. Just a brief look showed large number of SSH sessions and UDP packets destined to port 80 which seemed to be a little bit off, warranting further analysis.
1 2 3 4 5 6 7 8 9 10 11 | |
1 2 3 4 5 6 7 | |
1 2 3 4 5 6 7 8 9 10 11 | |
With such amount of traffic I needed a good way to document and represent network connection data in order to be able to correlate all suspicious events. I decided to use tshark to export important information to CSV files and then import them to Excel. This seemed to be the quickest and simplest way to organize the data I needed.
I started with HTTP and used following two commands to extract needed HTTP request and response data from the PCAP:
1
| |
1
| |
It was not that hard to correlate and combine both outputs. As you can expect number of HTTP requests roughly matched number of HTTP responses so it was just a matter of a single copy and paste operation to get them together in a single Excel worksheet. As a result each entry in my timeline contained fields extracted from both HTTP requests and responses making it much more readable (at least for me!).
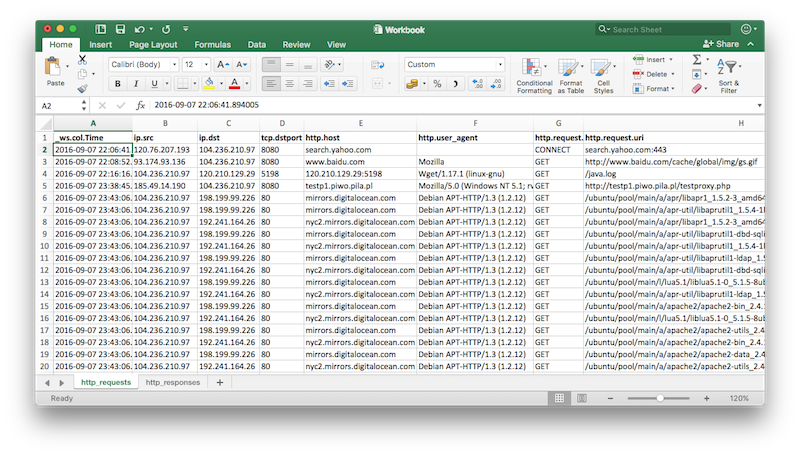
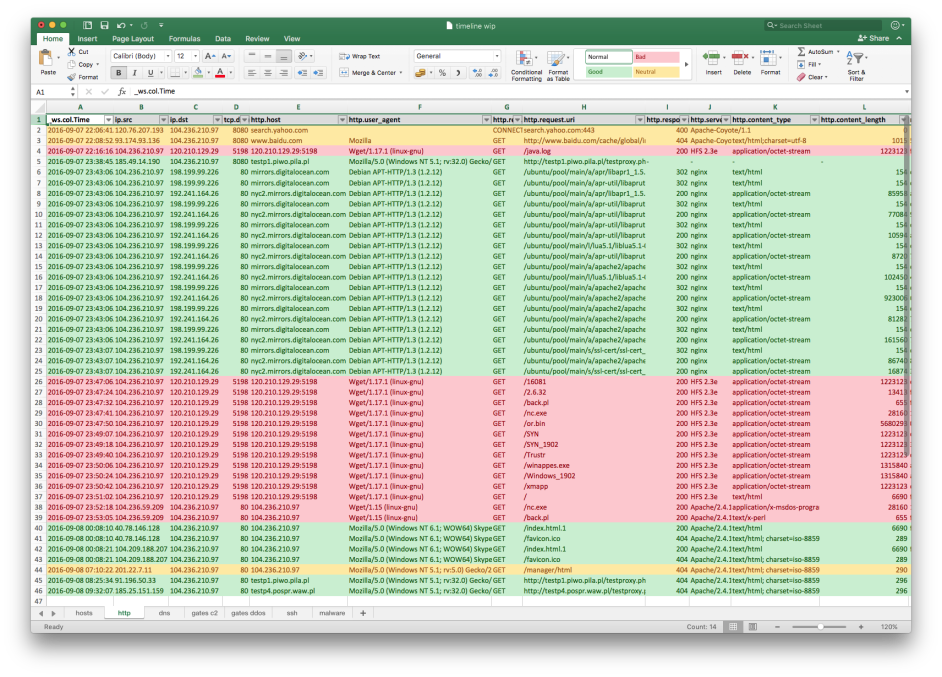
Having my HTTP timeline ready I started reviewing and marking entries with colors. At that point I still did not have a good understanding of intrusion but as some entries seemed to be more suspicious than others it was a good way to mark them for follow up.
Throughout my analysis I used three different colors to visually expose entries:
- Red: Malicious activity.
- Yellow: Neutral activity that can turn either side depending on further findings.
- Green: Benign activity.
After looking at collected HTTP entries I concluded that:
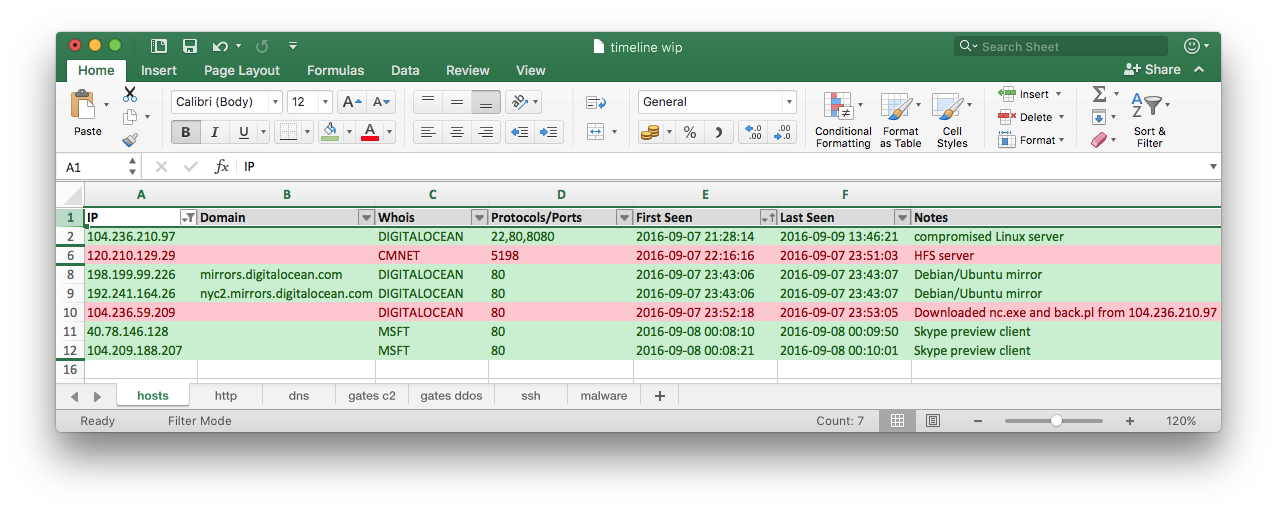
- All HTTP requests from 104.236.210.97 to 120.210.129.29 that matched the Snort rule indicated malicious activity.
- All HTTP requests from 104.236.210.97 to mirrors.digitalocean.com and nyc2.mirrors.digitalocean.com seemed to be benign as both servers are known mirrors for Debian and Ubuntu packages.
- Inbound HTTP requests from 104.236.59.209 to victim server 104.236.210.97 for nc.exe and back.pl seemed to be at least suspicious.
- All requests for testproxy.php seemed to be a part of common open proxy scanning and I disregarded them as benign and not related to the investigated case.
- I treated requests from Microsoft-owned IP addresses 40.78.146.128 and 104.209.188.207 as benign but potentially interesting. They seemed to come from Skype Preview service indicating that someone must have sent a link to hxxp://104.236.210.97/index.html.1 over Skype - maybe even attackers exchanged a link to newly compromised server?
- Rest of captured HTTP requests seemed to be a “background noise” and they were not relevant for further investigation.
As I was going through subsequent flows I started adding information about different IP addresses in a separate tab - just to have a handy source of reference.
Analysis of extracted files
Extracting files from the PCAP was not a particularly hard task. As all transfers I spotted were using HTTP I just used Wireshark’s Export Objects option:
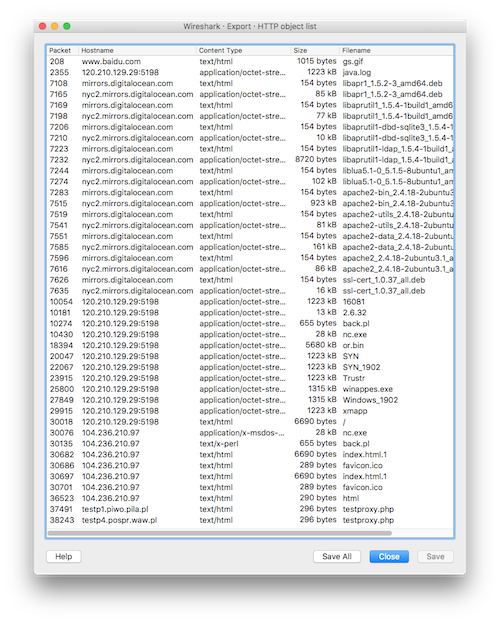
I quickly got rid of irrelevant HTML files as most of them just represented 404 (e.g. testproxy.php) or 302 (e.g. from mirrors.digitalocean.com) HTTP responses. Just by looking at file names and their sources I had suspicions which ones will turn out to be malicious. I did not bother investigating any of .deb files as they all came from legitimate source. I also assumed that in-depth analysis of every file was not a goal of the challenge - though I still wanted to extract all relevant network and endpoint indicators. Due to lack of time I decided to rely on basic static analysis, OSINT research and only when needed - dynamic analysis.
In the first place I gathered MD5s of files of interest and used Automater to quickly query VirusTotal:
- c3a59d53af7571b0689e5c059311dbbe (16081)
- ff1e9d1fc459dd83333fd94dbe36229a (2.6.32)
- cd291abe2f5f9bc9bc63a189a68cac82 (SYN)
- 3e9a55d507d6707ab32bc1e0ba37a01a (SYN_1902)
- cd291abe2f5f9bc9bc63a189a68cac82 (Trustr)
- a91261551c31a5d9eec87a8435d5d337 (Windows_1902)
- fbaeef2b329b8c0427064eb883e3b999 (back.pl)
- f07647a98e2a91ab8f3a7797854d795c (index.html.1)
- f4b3ec28a7b92de2821c221ef0faed5b (java.log)
- 1c207af4a791c5e87dcd209f2dc62bb8 (nc.exe)
- 09b62916547477cc44121e39e1d6cc26 (or.bin)
- a91261551c31a5d9eec87a8435d5d337 (winappes.exe)
- c5593d522903e15a7ef02323543db14c (xmapp)
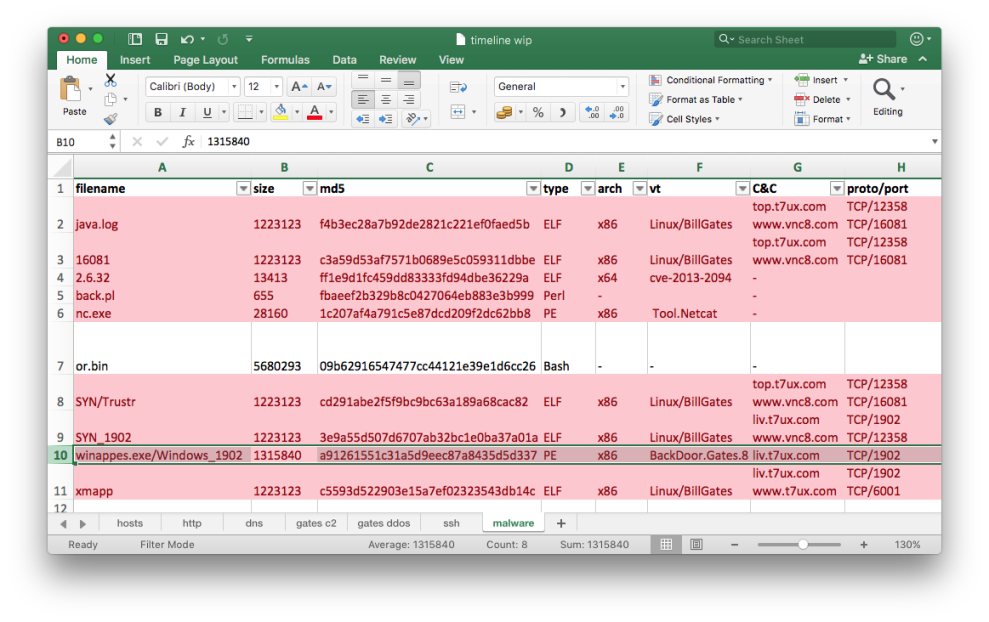
Except for the file or.bin (09b62916547477cc44121e39e1d6cc26), all queried files had detections from multiple AV products. I combined CSV output from the Automater to yet another tab in my timeline spreadsheet. I also added size, type and architecture (based on file output) columns:
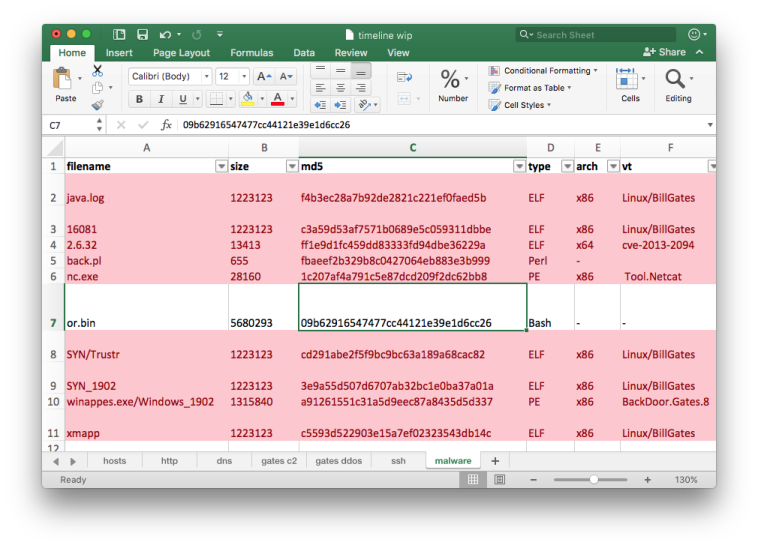
Below are my notes for the BillGates binaries and the or.bin script as I found them most relevant and interesting. I’m going to skip descriptions of other extracted files like nc.exe (Netcat) or back.pl (reverse shell Perl script) as cursory analysis immediately reveals what they are.
BillGates Malware
My goal here was just to confirm that all files detected as BillGates malware were in fact malicious. I also wanted to know how does network traffic generated by each ELF executable look like. I thought that identifying such traffic in the PCAP could give me new interesting leads.
After reading several awesome write-ups on BillGates from Akamai, MalwareMustDie and Novetta I knew what to look for in collected files.
Thankfully all files were not stripped so simply running strings on them revealed some interesting details. I also noticed that all ELF files were exactly 1223123 bytes long - it was yet another indicator that they belong to BillGates malware family.
1 2 3 4 5 6 | |
All ELF files contained references to source code files that were almost identical to ones identified by Novetta and MalwareMustDie in their reports.
1 2 3 4 5 6 7 8 9 10 11 12 13 14 15 16 17 18 19 20 21 22 23 24 25 26 27 28 29 30 31 32 33 34 35 36 37 38 39 40 41 42 43 44 | |
The last file (a91261551c31a5d9eec87a8435d5d337) was a PE binary. DrWeb’s detection on VirusTotal claimed that it was BackDoor.Gates.8. I was not aware about Windows versions of BillGates malware but Stormshield’s blog post quickly got me back on the right track.
As described by Stormshield, the file contained multiple embedded PE binaries inside its resources section:

1 2 3 4 5 6 7 8 | |
At that point I was confident that I can identify all these files as belonging to BillGates malware family in my report. The last thing I needed were network indicators.
I followed the below process for ELF files in order to obtain C&C address, protocols, and ports used for C&C communications:
- I configured my Linux VM to use my other Windows VM running in the same isolated network segment as a DNS server.
- I configured FakeNet to respond with IP address of my Windows VM for every observed DNS request.
- I ran Wireshark and FakeNet on my Windows VM.
- I executed sample and observed issued DNS requests.
- I observed subsequent connection attempts and when needed I adjusted FakeNet’s configuration so it listened on specific port that malware was trying to connect.
- I noted C&C addresses, used ports and saved captured traffic to PCAP file for further reference.
Below is sample analysis for the SYN binary (cd291abe2f5f9bc9bc63a189a68cac82):
1 2 3 4 5 6 7 8 9 10 11 12 13 | |
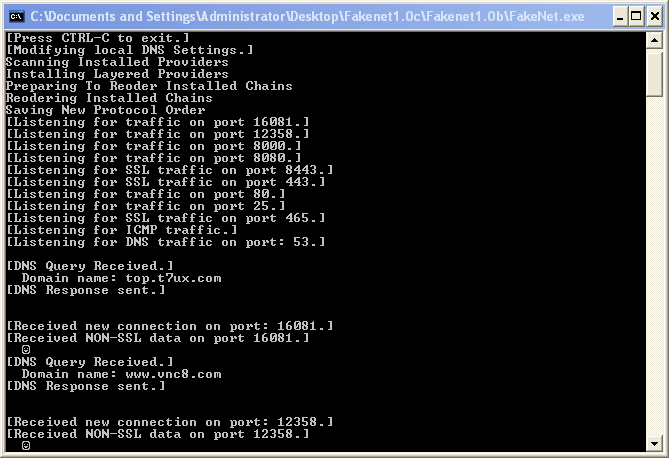
The process for Windows version of malware (a91261551c31a5d9eec87a8435d5d337) was much simpler as I just needed to execute it in my Windows VM and observe FakeNet’s output.
Next I updated my Excel spreadsheet with collected network indicators and proceeded to the next extracted file.
or.bin
or.bin was an interesting file. Beginning of the file contained simple Bash script that read and extracted a tar.gz archive appended to the end of the script. When extracted it just started install binary:
1 2 3 4 5 6 7 8 9 10 11 12 | |
The install file seemed to be a stripped 64-bit ELF binary. Interestingly, the archive contained also a file named ooz.tgz which was not a tar.gz archive as suggested by its extension. The file contained very specific header “Salted__” indicating that it was encrypted using OpenSSL.
1 2 3 4 5 6 7 8 9 10 11 | |
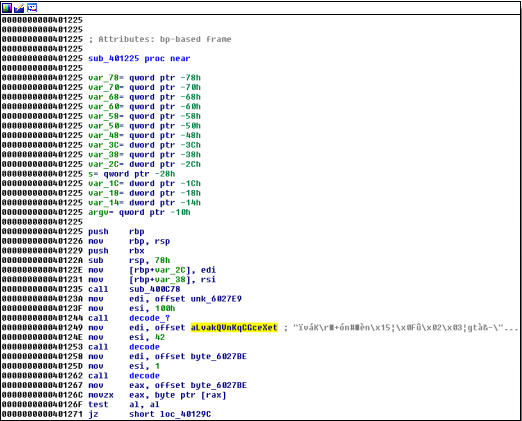
It looked like I would need to analyze the install file to learn how to decrypt ooz.tgz. Unfortunately, after initial inspection I knew that it will not be that easy. Binary seemed to implement several anti-analysis techniques. All strings in the binary were obfuscated:
Basic anti-debugging was implemented by making one of the child processes attach to the main process using a ptrace() call, effectively preventing use of debuggers and tools like strace:
1 2 3 4 5 6 7 8 9 10 11 12 13 14 15 16 17 18 19 | |
When I placed the file in a separate directory (so it did not ‘see’ ooz.tgz) and executed it, I noticed some strange output - like it was trying to spawn system commands:
1 2 3 4 5 6 7 8 9 10 11 12 13 14 15 16 17 | |
If my suspicion was correct, the program was deobfuscating strings during runtime and then passing them as arguments to execvp() function (which was visible when I opened the binary in IDA). I needed a way to get insight into what exactly is passed to execvp() calls without actually attaching debugger to the process.
After short research I found snoopy which seemed to do exactly what I needed. After enabling Snoopy and running install binary again I found following entries in a log file:
1 2 3 4 5 6 7 8 9 10 11 12 13 14 15 16 17 18 19 20 21 22 23 24 25 26 27 | |
Bingo! It looked like the binary was decrypting ooz.tgz file with the DES3 key buWwe9ei2fiNIewOhiuDi, decompressing the archive and then compiling OpenSSL and OpenSSH from resulting source code. That definitely looked suspicious!
1 2 3 4 5 | |
The decrypted file contained yet another archive jack.tgz which in turn contained source code archives for OpenSSL, OpenSSH and zlib.
1 2 3 4 5 6 | |
I assumed that the final goal of the install binary was to install a modified version of OpenSSH and proceeded to closer inspection of the OpenSSH archive.
The great thing about tar archives is that by default they preserve some metadata about the archived files, including file ownership and modification timestamp. I skimmed through output of ls -lR command and it did not took long to notice that small part of the files from the extracted archive openssh-5.9p1.tgz had different owner (root) and much later modification time than the rest:
1 2 3 4 5 6 7 8 9 10 11 12 | |
As far as I could tell all modifications were consistent with OpenSSH backdooring article presented in this e-zine.
1 2 3 4 5 6 | |
I stopped analysis of the or.bin file at this stage. With the new lead I kept a mental note to check the PCAP for (suspicious) SSH connections later on.
DNS Analysis
My primary goal here was to check if PCAP contained any DNS queries for malware C&C domains identified earlier. I thought it would be a good indicator that malware was executed on a compromised server. Instead of checking each domain one by one I decided to export all DNS queries and responses from the PCAP and add them to my spreadsheet:
1
| |
I was not really surprised when I saw that first DNS query recorded in the PCAP was for one of known domains top.t7ux.com:
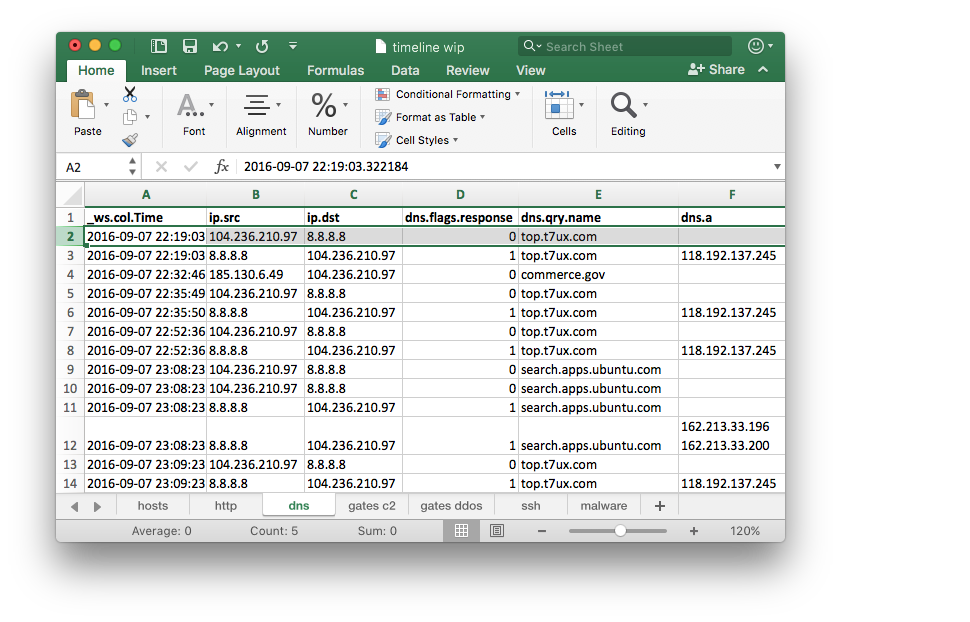
As I was able to easily filter my results I immediately knew that the domain resolved to two different IP addresses:
- 118.192.137.245 (until 2016-09-08 10:39:57Z)
- 222.174.168.234 (starting at 2016-09-08 10:18:13Z)
I noted the following timestamp: 2016-09-07 22:19:03Z as an approximate time when malware was executed on a compromised system. I did not have any hard proofs but it was a good start.
I also briefly reviewed other DNS queries sent by the compromised server, but I did not find anything else worth digging in. There was just this one strange query sent at 2016-09-07 23:53:44Z:
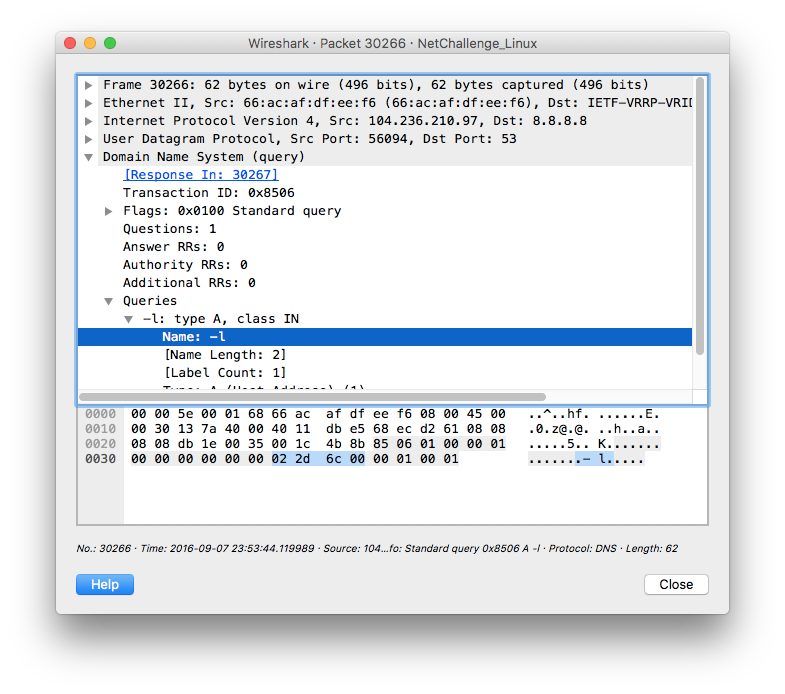
Was it possibly an attacker and his fat fingers mistyping something like host
C&C Traffic Analysis
Getting actual C&C traffic was easy as I already knew IP addresses, protocols and ports used by malware. I decided to export each C&C packet to be able to see any changes in beaconing pattern. Initially I filtered out all retransmitted packets for better visibility.
I used the following tshark options to export all C&C traffic to a CSV file:
1
| |
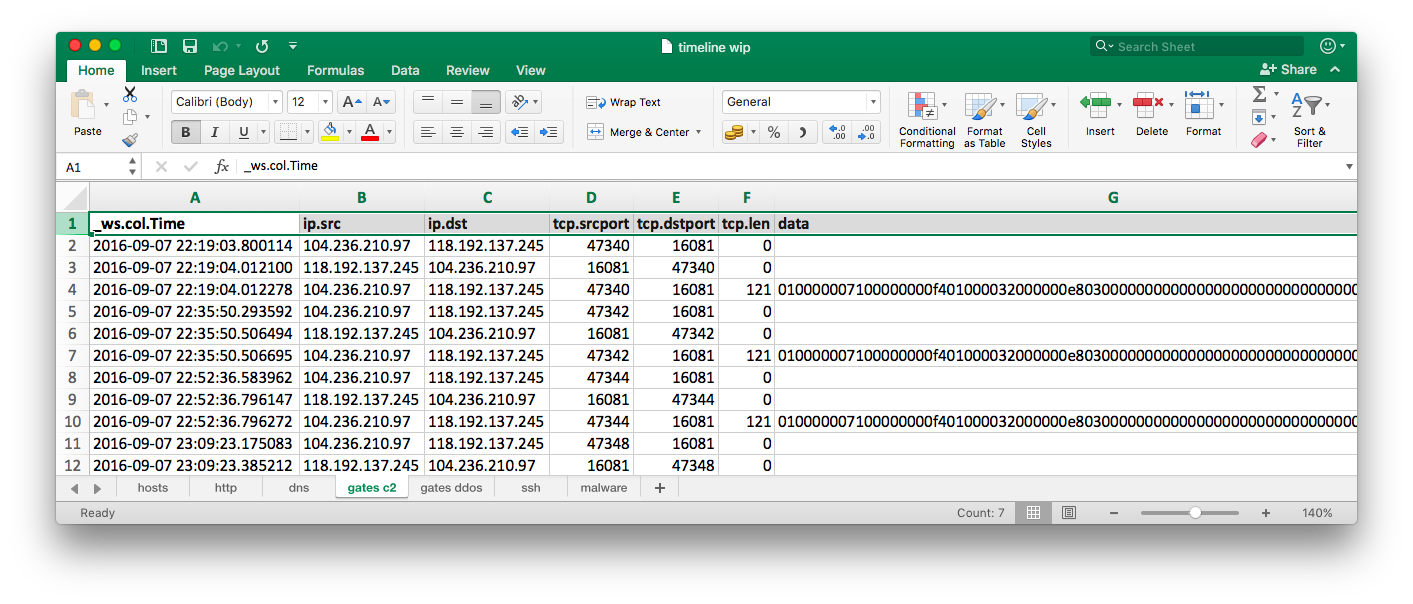
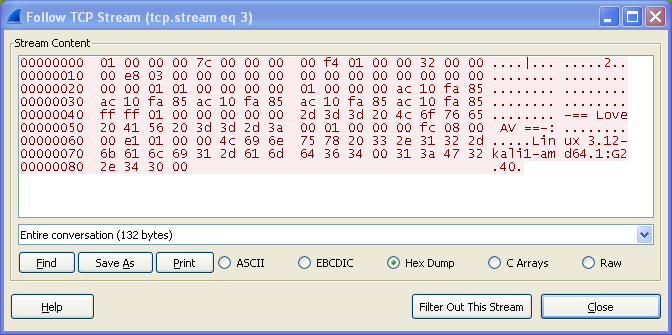
When I was analyzing the beaconing pattern, I noticed that for the first ~12 hours malware sent 45 identical messages, each approximately 15 minutes apart from the previous one. Based on Akamai’s write-up I was able to extract following information from captured messages:
- IP address of the infected machine: 0x68ecd261 (1760350817) => 104.236.210.97
- DNS addresses: 0x68ecd261 (1760350817) => 104.236.210.97
- Number of CPUs: 1
- CPU MHz: 0x95f (2399)
- Total memory: 0x1e8 (488)
- Kernel name and version: Linux 4.4.0-36-generic
- Malware version: 1:G2.40
![]()
There were no responses from any of C&C servers until 2016-09-09 13:46:05Z when 222.174.168.234 sent 18 messages containing following data 0400000000000000 in one second intervals.
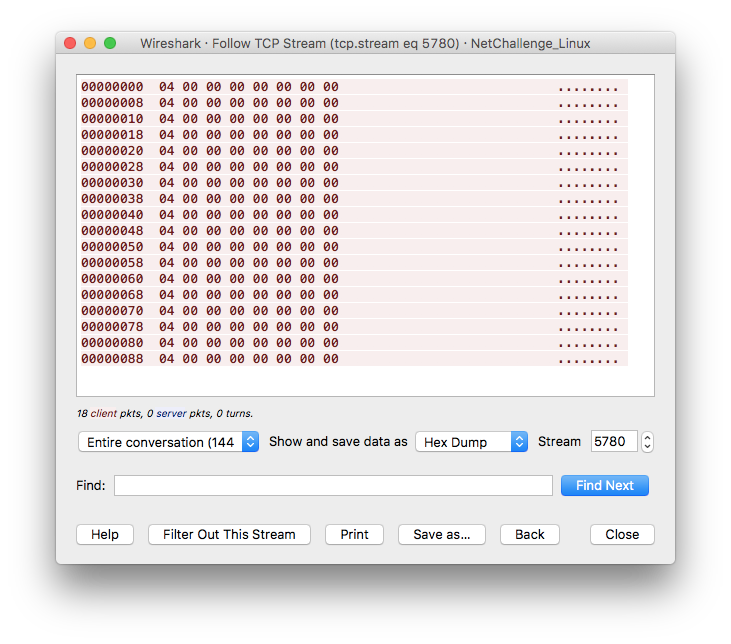
But here is the problem - only by accident I noticed that there was some additional data exchanged between compromised system and C&C that I missed due to display filter I used to export data with tshark. Wireshark also did not show that data in the “Follow TCP Stream” windows as it was not able to correctly reconstruct entire conversation.
The exchanged data turned out be be crucial for further investigation. For every 0400000000000000 message sent by C&C there was a response packet from the compromised host containing what looked like an IP address:
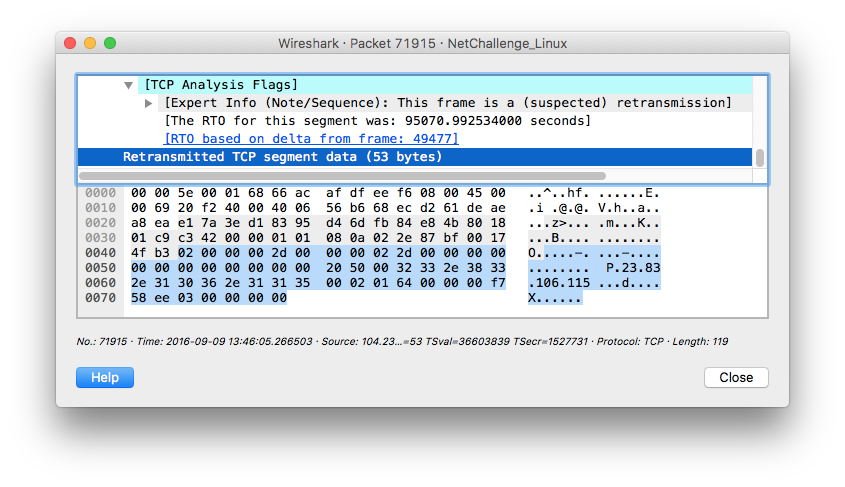
This message exchange resembled what @unixfreakjp named “3rd step” in his post on KernelMode.info. Nowhere in the PCAP did I find initial two steps of communication between compromised host and C&C (222.174.168.234).
Yet again I referenced Akamai’s write-up and I noticed that responses sent by compromised host to some degree mirrored initial command message sent by C&C (which was missing in the provided PCAP). Based on their analysis it looked like in this case the malware was instructed to perform a DoS attack against IP address 23.83.106.115 over UDP (value 0x20) port 80 (0x50). Nice, one more lead to check!
UDP Analysis
I jumped straight into checking if any suspicious UDP traffic was present in the provided packet capture. I used Wireshark and its “Statistics -> Conversations” menu:
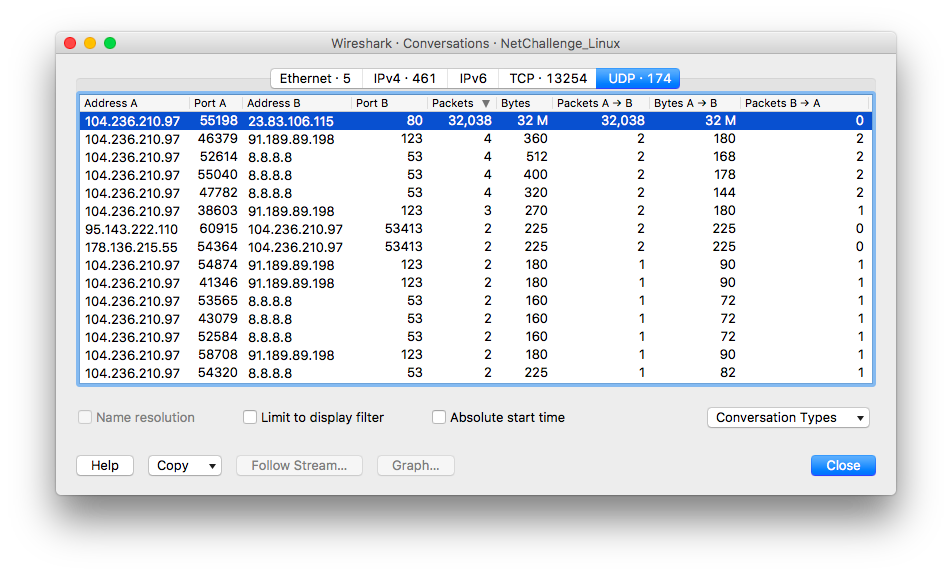
32038 UDP packets on port 80 sent from 104.236.210.97 towards 23.83.106.115? Well, that was kind of… expected (I also recalled 32082 QUIC packets listed by tshark in the Protocol summary. As the rest of UDP conversations seemed pretty standard I simply exported all metadata about UDP packets sent to the attacked host:
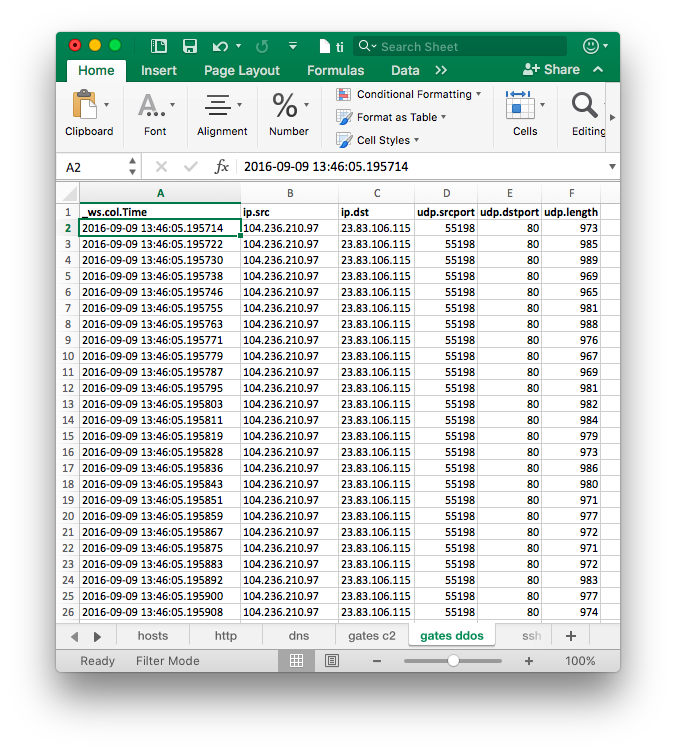
1
| |
The amount of packets and short interval between them was telling. Compromised host transferred approximately 32 megabytes of data in just half a second. All packets were sourced from UDP port 55198 and were between 965 and 989 bytes long (minus static 8 byte UDP header).
SSH Analysis
Although at this stage I had good overview of what happened, I was still missing one important piece of the puzzle - initial infection vector. Based on couple of writeups I knew that actors behind the BillGates botnets very often compromise Linux machines by using SSH and brute forcing root password.
Using my standard ‘per-packet’ tshark export format was not of much help in this case as I wanted to know length of each session and amount of exchanged data. My initial assumption was that by looking only at these values I’ll be able to tell which SSH session was successful (as in: user provided correct username and password and was granted access to console) and which was not (e.g. it was a failed brute-force attempt). I needed to know if there was any successful session established just before suspicious events started occurring on the compromised host or if there were any brute-force attempts.
I quickly tested two scenarios where I connected to my VPS over SSH and captured traffic for both successful logon and failed attempts (3 seems to be a default setting for OpenSSH). Getting a command line prompt needed approximately 8500 bytes to be exchanged between SSH client and server (in ~24 packets). Three consecutive (failed) login attempts generated approximately 6700 bytes (in ~26 packets). These were of course rough estimates and likely were dependent on specific configuration but at least they gave me some idea. I assumed that every SSH conversation with higher number of exchanged data and frames would be indicative of successful user login over SSH protocol.
I used the following command to list all TCP conversations in the challenge PCAP and then filtered out all that were not over port 22:
1 2 3 4 5 6 7 8 9 10 11 | |
Based on lengths of sessions and amount of exchanged data I selected two SSH clients: 46.101.128.129 and 71.171.119.98. In case of 46.101.128.129 both SSH sessions started just before first HFS file download occurred (at 2016-09-07 22:16:16Z). Taking into account timing and lack of any other suspicious connections I assumed it was the attacker that successfully authenticated to the compromised host over SSH. My suspicion was that the initial session was a successful brute-force attempt, while the second session was used to deploy malware and adjust compromised host to attacker’s needs. Looking at short time between both sessions and also between subsequent events it was evident that whole process was at least semi-automated. As a side note I need to say that I would restrain from formulating such far-reaching conclusion if it was a real life scenario and I would definitely try to obtain additional evidence!
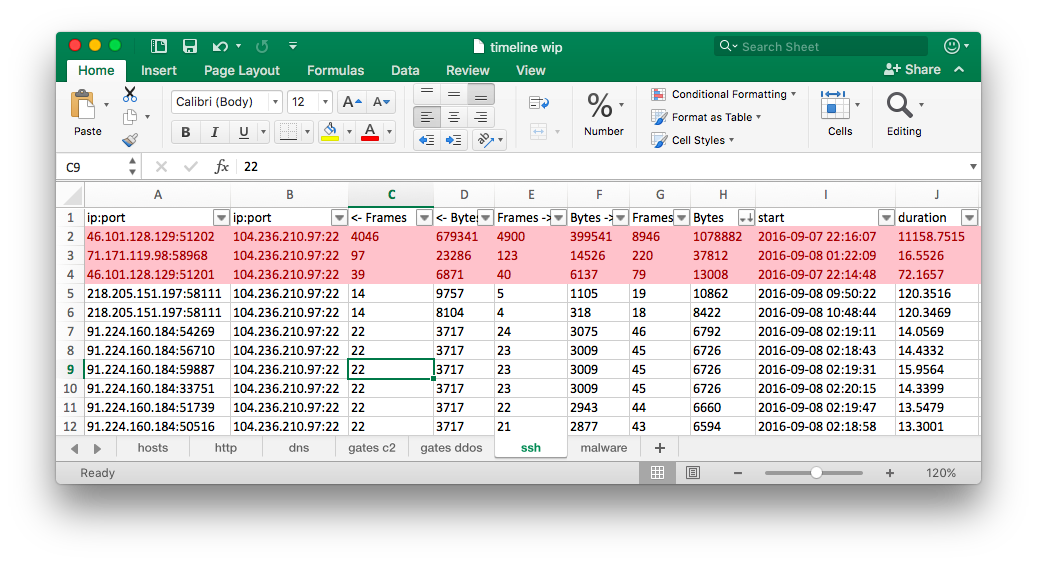
The PCAP did not contain initial handshake for SSH connection from the IP address 71.171.119.98 and thus I was not able to tell when the session has started (prior or after attacker’s activity) and if the session was much longer than 16 seconds reported by Wireshark.
Rest of the SSH connections seemed to be unsuccessful brute force attempts. Most of them were characterized by the use of the libssh library by clients (visible in the initial SSH message from the client), short duration and low number of exchanged data.
Putting It Together
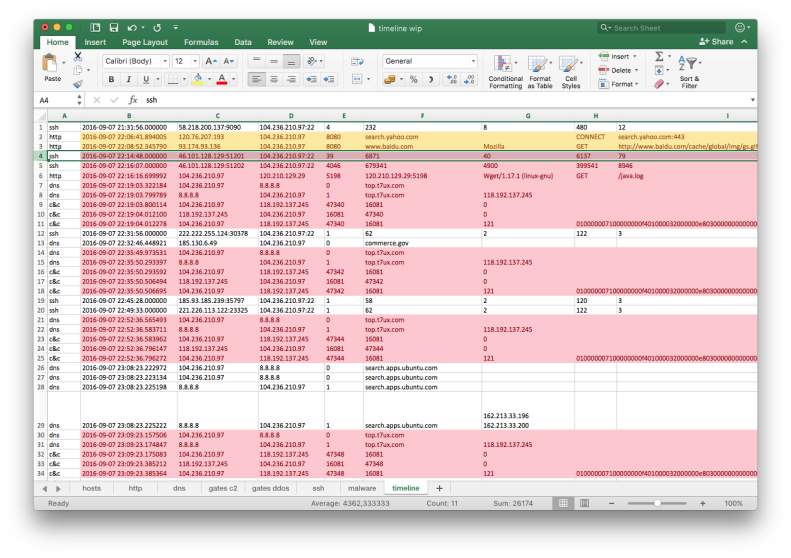
Having all the data and findings handy it was just a matter of drafting a final report with answers to challenge questions. As a final step I proceeded with creating a master timeline as a an ultimate source of reference. Not having much time left I did not bother with proper formatting or using any template - I simply thrown all entries into a new Excel sheet and sorted them by timestamp. The story of a breach was immediately apparent:
That is it! As mentioned in the beginning, the final write-up was posted by @TekDefense on his blog. You can also find timeline spreadsheet here.