Scenario
Network X is an isolated, highly secured and monitored part of the network where Nation’s Secrets are stored. Team responsible for monitoring the infrastructure reports suspicious activity on one of the servers WIN-UC6FN0KAUGQ (10.10.100.100) including failed authentication attempts, originating from a host within the same geographic location as network X. The suspected machine’s is WIN-569IC7NK834 (10.10.100.50). IR team was called to investigate. Reported time of the suspicious activity: 2015-01-28T19:30:24Z.
Data Collection and Analysis
Every investigation is all about getting as much context as possible. This gives handlers better understanding of what happened and in turn it influences decision what to do next. At this point the only available information are few suspicious authentication attempts. Data collected by Redline’s Comprehensive Collector would be the best option to start our initial investigation.
Collection steps include:
- Incident Handler creates and sends collector to Administrator responsible for executing it on suspicious machine.
- Administrator logs to box with temporary created account, and executes collector.
- Archived results are sent to Incident Handler in a secure, predefined way (e.g. SFTP server).
- Incident Handler downloads the file and start the analysis in a preconfigured Virtual Machine.
Analysis
Where do we start? Each investigation is different and each handler has its own style. For most of the investigation one of the following strategies should yield satisfactory results:
- Timeline analysis (based on the time of suspicious activity)
- Data analysis (based on information about suspicious activity)
Timeline analysis
This one is fairly simple the only requirement is to have approximate time of suspicious activity.
- Build a timeline based on all collected data.
- Set up a timeframe e.g. 30 minutes.
- Review events that occurred within defined timeframe before and after the suspicious activity.
- Look for anything that is out of ordinary.
- Follow up on all suspicious events with additional investigation.
- If nothing suspicious was found start again at step 2 and extend the timeframe.
Let’s test this approach in on our scenario.
Collected data can be loaded in Redline by double clicking the .mans file and selecting the type of investigation:

On the Analysis data panel select Timeline:
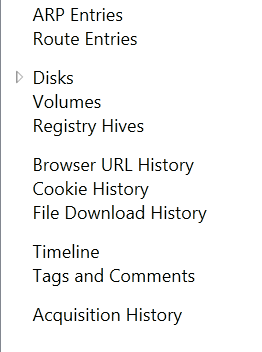
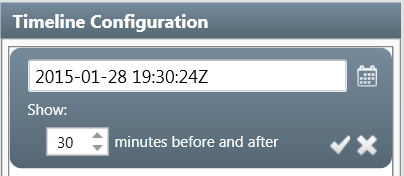
Redline will build the timeline based on all collected events. Next step is to define a TimeWrinkle which is a basic filter that will show only entries within defined time frame.
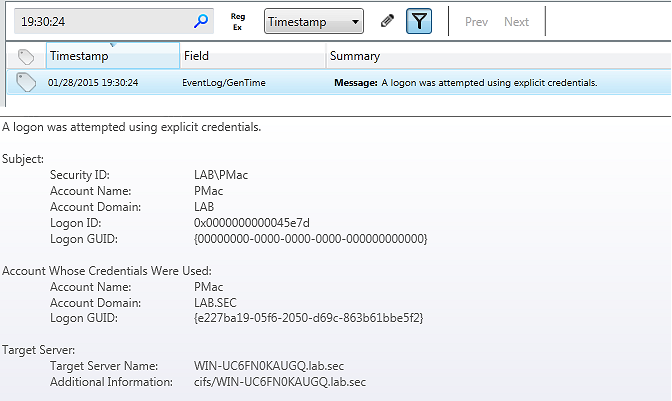
One of the Windows Event Log entries close to the time of suspicious activity correlates with the usage of explicit logon credentials by user PMac against the target machine.
Let’s see what happened before user PMac tried to authenticate.

Processes cmd.exe and conhost.exe were spawned by the user PMac two minutes before the explicit logon event. It might be worth checking memory ranges for conhost.exe as this process usually holds history of user’s activity in a Windows command line (this is true for Windows 7/2008R2 or higher, for earlier versions you should focus on csrss.exe memory ranges). Dumping memory for given process with Redline can be easily achieved. Double clicking on conhost.exe displays the process information page. Select MRI Report and hit Acquire Process Address Space (assuming collector acquired memory). All memory ranges for given process will be extracted in the background. Let’s not waste time and continue with the timeline analysis.

There was nothing interesting in the timeline until we stumbled across the following entry: suspicious m64.exe file in a root directory.

Next step would be to get the file and perform initial analysis. Unfortunately Redline collects information about the metadata of the files within filesystem. File would have to be extracted manually, for instance by the same administrator that run the collector (sometimes it is possible to extract files from the memory image using e.g Volatility).
Now it is time to take a closer look at what happened in our timeline after the explicit logon attempt occurred.
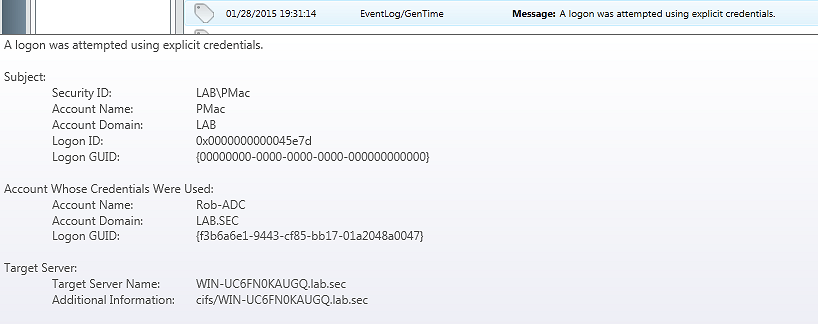
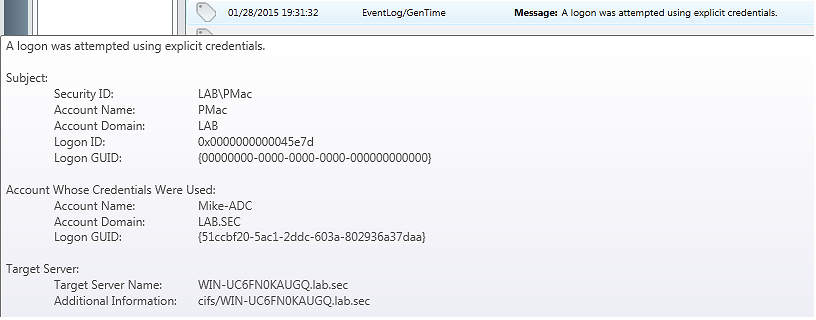
Initial report mentioned few suspicious logon attempts. Using search feature we can look for other explicit credentials events:
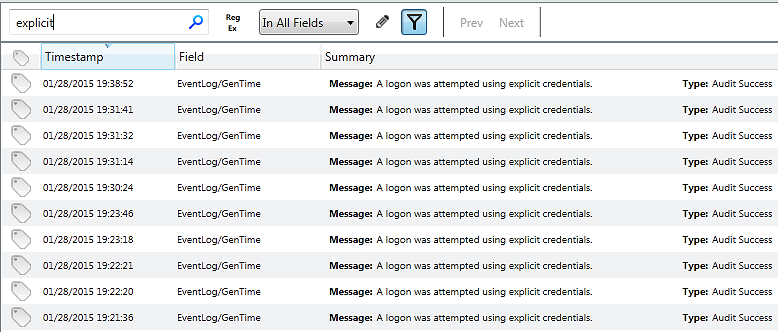
Apparently user PMac tried to use Rob’s account…
Mike’s account…
and Bob’s account against the target server:
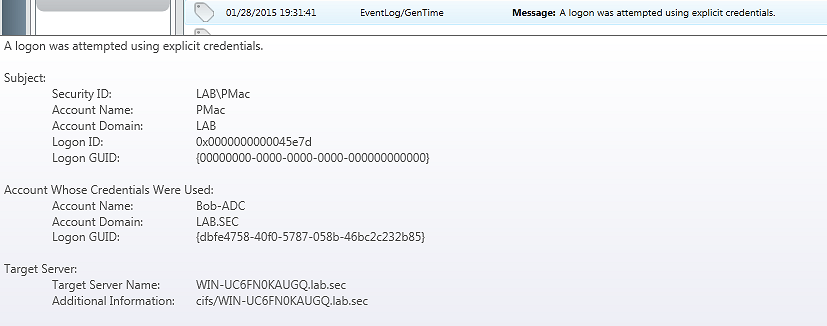
Interestingly enough the time differences between the logons were very short and suggest more of an enumeration activity.
Let’s get rid of the filter and examine closely all related entries for each explicit credentials event log entry. Nothing interesting for the first two logons, however entries surrounding third explicit logon give us more details. Registry changes suggest some sort of network activity, which might be related to accessing a network share on our protected target server by user Bob-ADC. This doesn’t look good at all!

Let’s summarize the findings of our analysis so far:
- The file
m64.exewas present in the root directory onWIN-569IC7NK834(10.10.100.50) before suspicious logon started. - Followed by authentication attempts using four different sets of credentials against protected target server
WIN-UC6FN0KAUGQ(10.10.100.100). - Evidence suggesting mounting a remote network share (root directory) on the protected server
WIN-UC6FN0KAUGQ(10.10.100.100) was recorded in the Windows registry onWIN-569IC7NK834(10.10.100.50).
There is still plenty of stuff to investigate further. What about the conhost.exe memory ranges? Redline finished dumping the files to disk after few minutes so it’s time to review memory ranges with good old strings.exe from Sysinternals.
After endless scrolling through strange hex, numbers and letters eventually a needle in a haystack was found!
Strings inside the conhost.exe process memory revealed commands executed on the host WIN-569IC7NK834 (10.10.100.50) by user PMac (everyone loves memory forensics!):
C:\Users\PMac.LAB>net view
Server Name Remark
----------------------------------------------------------------
\\WIN-569IC7NK834      Lab-Desktop
\\WIN-UC6FN0KAUGQ      Secure-Lab1
The command completed successfully.

C:\Users\PMac.LAB>net use X: \\WIN-UC6FN0KAUGQ\C$
The password is invalid for \\WIN-UC6FN0KAUGQ\C$.
Enter the user name for 'WIN-UC6FN0KAUGQ': PMac
Enter the password for WIN-UC6FN0KAUGQ:
System error 5 hasoccurred.
Access is denied.

C:\Users\PMac.LAB>net use X: \\WIN-UC6FN0KAUGQ\C$
The password is invalid for \\WIN-UC6FN0KAUGQ\C$.
Enter the user name for 'WIN-UC6FN0KAUGQ': Rob-ADC
Enter the password for WIN-UC6FN0KAUGQ:
System error 5 hasoccurred.
Access is denied.

C:\Users\PMac.LAB>net use X: \\WIN-UC6FN0KAUGQ\C$
The password is invalid for \\WIN-UC6FN0KAUGQ\C$.
Enter the user name for 'WIN-UC6FN0KAUGQ': Mike-ADC
Enter the password for WIN-UC6FN0KAUGQ:
System error 5 hasoccurred.
Access is denied.

C:\Users\PMac.LAB>net use X: \\WIN-UC6FN0KAUGQ\C$
The password is invalid for \\WIN-UC6FN0KAUGQ\C$.
Enter the user name for 'WIN-UC6FN0KAUGQ': Bob-ADC
Enter the password for WIN-UC6FN0KAUGQ:
The command completed successfully.

C:\Users\PMac.LAB>dir X:
Volume in drive X has no label.
Volume Serial Number is 16EE-2261
Directory of X\
01/25/2015  04:43 PM    <DIR>          inetpub
07/14/2009  03:20 AM    <DIR>          PerfLogs
01/25/2015  05:19 PM    <DIR>          Program Files
01/25/2015  04:28 PM    <DIR>          Program Files (x86)
01/25/2015  05:41 PM    <DIR>          Users
01/25/2015  06:55 PM    <DIR>          Windows
        0 File(s)              0 bytes
        6 Dir(s)  16,423,743,488 bytes free

C:\Users\PMac.LAB>xcopy C:\m64.exe X:\ /K
C:\m64.exe
1 File(s)copied

C:\Users\PMac.LAB>dir X:
Volume in drive X has no label.
Volume Serial Number is 16EE-2261
Directory of X:\
01/25/2015  04:43 PM    <DIR>          inetpub
11/20/2010  09:29 PM    302,592 m64.exe
07/14/2009  03:20 AM    <DIR>          PerfLogs
01/25/2015  05:19 PM    <DIR>          Program Files
01/25/2015  04:28 PM    <DIR>          Program Files (x86)
01/25/2015  05:41 PM    <DIR>          Users
01/25/2015  06:55 PM    <DIR>          Windows
        1 File(s)        302,592 bytes
        6 Dir(s)  16,426,651,648 bytes free
So what exactly happened here?
Someone tried to view the available network resources with the net view command and then failed to mount a remote share using different accounts (PMac, Rob-ADC, Mike-ADC). The last attempt using Bob-ADC credentials successfully mounted network share. After that the attacker copied suspicious file m64.exe to remote location. If the file was not suspicious enough when we’ve looked at it for the first time, now it would be really good to speed up our malware analysts to get as much information as possible regarding the file.
Creating an IOC
Building IOCs is based on the Boolean logic and keywords. For instance we can use Event Log ID 4648 to look for any existence of explicit credentials in Event log:
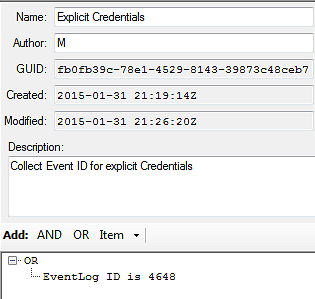
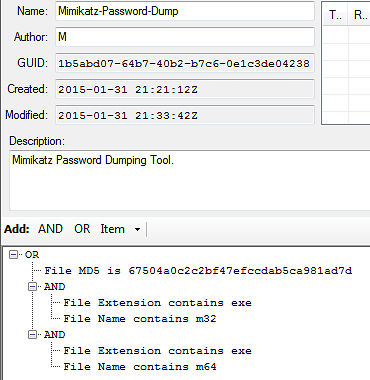
Let’s assume that malware analyst came back with the results: m64.exe is recompiled version of Mimikatz - a well known password dumping tool.
For instance an IOC can be built based on the name for both 32 and 64 bit platforms, extension and MD5.
Hunting with IOCs
In real case scenario this would be a good time to gather all the findings from the initial investigation and sweep across estate for more machines that indicate similar suspicious activity. It would be a good starting point to extract all activity of compromised accounts from the Domain Controller and run IOC collectors on all machines where any of those accounts were recorded. It might be worth considering to add collection of all event logs and/or memory to your collector.
When analyzing the data collected by the IOC Collector open the analysis file and select:

Select the folder with IOCs:

Choose IOCs:
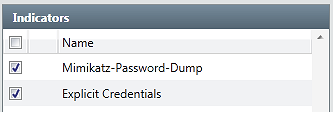
The report will be generated in the background. When it is ready click the IOC Report on the bottom left side and review your IOC report.

You found more indicators of compromise on other machines? Cool now you can iterate through our process with the new findings.. Repeat the same process over and over again in order to understand what exactly happened. Eventually this will allow you to get rid of the bad guys, sharpen your tools and be more prepared for another round!
Feel free to stick around for part 3 of the series if you want to learn more about other tools to analyze data collected by Redline.